Semiotic
A React data visualization library for charts, networks, and streaming data. An ongoing exploration of how thoughtful defaults and expressive tools can make complex visualization more approachable.
Explore Semiotic ↗ Source code ↗Elijah Meeks / Data visualization & rhetoric
I build tools, write, and make visualizations that help people see the relationships inside their data.
Explore my workA React data visualization library for charts, networks, and streaming data. An ongoing exploration of how thoughtful defaults and expressive tools can make complex visualization more approachable.
Explore Semiotic ↗ Source code ↗
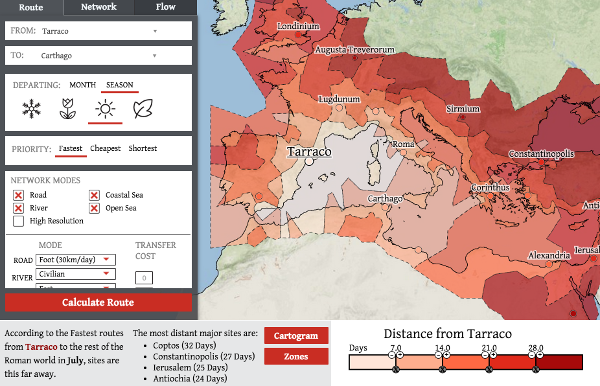
Modeling movement, distance, and connection across the Roman world. A collaborative project at Stanford.
Digital humanities / Networks / Geography
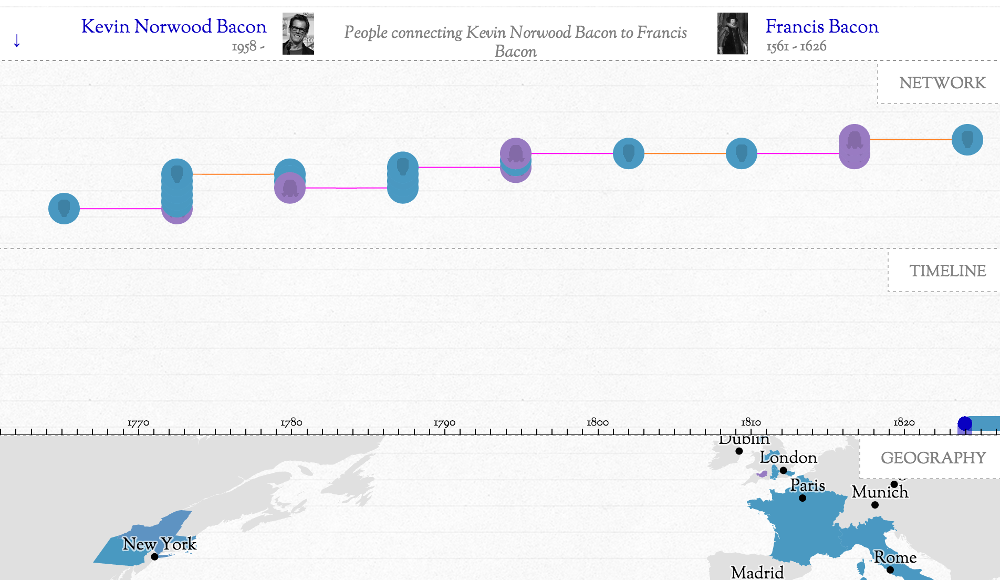
Looking at British history through a network of family relationships. A collaboration of scholarship, design, and code.
History / Networks / StorytellingLearning to think in data, design in code, and build interactive visualizations for the web. First and second editions by Elijah Meeks.
Read about the book ↗Flows, paths, and the visual rhetoric of Sankey diagrams · 2015
How similarity, proximity, and enclosure shape what we see.
From the archive: color choices and visualization design · 2015
Seeing the structures that lists and tables leave out.
I'm Elijah Meeks, a data visualization practitioner, author, and open source developer. My work sits at the intersection of design, code, and the humanities.
I've built visualizations at Netflix and interactive scholarly projects at Stanford, written D3.js in Action, and created tools for exploring networks, geography, and complex systems.
I'm interested in the choices we make when we turn data into pictures: what we reveal, what we obscure, and how we help people find meaning.
Find my code on GitHub ↗Ideas, questions, or interesting data?