From the original site
This archived piece preserves its original text and historical context.
ORBIS: The Stanford Geospatial Network Model of the Roman Empire (v2)
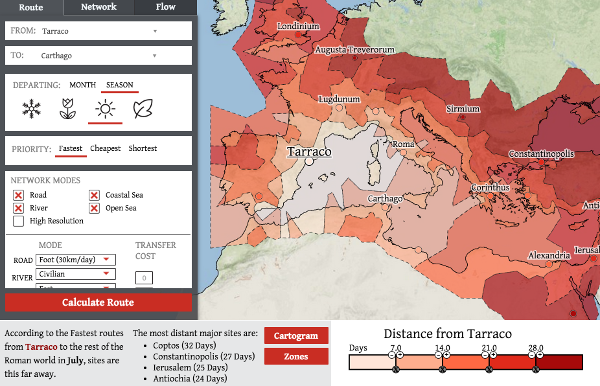
A refresh of the original ORBIS, this featured an entire rewrite of the UI. While the older version was built with Ext, OpenLayers and some D3, this version is entirely built with D3 using a custom UI. It includes features unachievable in the first ORBIS, such as user-driven dynamic distance cartograms, as well as brand new features, like clustering the network into different regions. The map leverages topologically aware voronoi to give the user regions, and also produces PNGs of results using HTML5 Canvas and .toDataURI to dynamically generate appropriate figures for researchers.
What went right
Version 2 of ORBIS allows users to do so much more than calculate routes. They can add transition costs for paths that switch modes (such as sea to road or river), turn off certain parts of the network, and see aggregated results correlated to edges or nodes.
What went wrong
It doesn't work so well on Firefox and doesn't work at all on older browsers. That's a cost of using D3 throughout and not an off-the-shelf mapping library like Leaflet.
Worse, though, is that of the 200,000 queries run on ORBIS v2, only 3.5% are network queries and only 3.25% are minard queries, so obviously the UI and associated contextual help and tutorials did not reveal to users how to use these features well enough.
The next version would have
An integrated |via component. I still think that kind of situated perspective and gameplay-inspired interaction would be immediately accessible to an audience and provide a valuable perspective.