This is a set of slides that supplements a workshop I give on effective network data visualization. Press → and sometimes ↓ to see more information.
While these slides are not meant to stand alone, they do provide examples and code that should help you to better understand network data visualization in D3.js
Creating Effective Network Data Visualization
with d3.js
@Elijah_Meeks
Why visualize networks?
because they look so cool
Systems
Relationships
Why use D3?
- Complex Networks Require Interactiivity
- Network Data Visualization Needs General Data Visualization Components
Network Types
Hierarchical
Directed Acyclic Graph (DAG)
Other
Hierarchical
Directed Acyclic Graph (DAG)
Other
Network Attributes
Directionality
Multipart
Edge Complexity
Directionality
Directed
Undirected
Self-Loops
Multipart
Bipartite
K-Partite
Multimodal Network Projection
Edge Complexity
Weight
Parallel Edges
Negative Links
Network Data Types
Matrix
Edge List
GraphML/GEXF
Bad Network Layouts You Shouldn't Use
Circular
Radial
Circular
Radial
Static Layouts
Arc Diagrams
Go to the BlockAn arc diagram lays out nodes along a line and draws the connections between them as arcs from one node to another. It can encode directionality by placing connections that are from earlier nodes to later nodes above the line and those that are from later nodes to earlier nodes below the line.
Here is a simple arc diagram layout to play with in D3.
Code
var someColors = d3.scale.category20b();

d3.json("miserables.json", createArcDiagram);

function createArcDiagram(data) {
  //create some random back links just to demo the functionality
  data.links.forEach(function (link) {
    if (Math.random() < .1) {
      data.links.push({source: link.target, target: link.source, value: 1})
    }
  });

  var arcDiagram = d3.layout.arcDiagram()
  .size([450,250])
  .nodes(data.nodes)
  .links(data.links)
  .nodeID(function (d) {return d.name});

  //initialize the arc diagram
  arcDiagram();

      var arcG = d3.select("svg#arc-diagram")
      .append("g").attr("id", "arcG")
      .attr("transform", "translate(25,0)");

      arcG.selectAll("path")
         .data(data.links)
         .enter()
         .append("path")
         .attr("class", "arc")
         .style("stroke", function (d) {return someColors(d.source.group)})
         .style("stroke-width", 2)
         .style("opacity", .25)
         .style("fill", "none")
         .attr("d", arcDiagram.arc);

    arcG.selectAll("circle")
        .data(data.nodes)
        .enter()
        .append("circle")
        .attr("class", "node")
        .attr("r", 2)
        .style("fill", function (d) {return someColors(d.group)})
        .attr("cx", function (d) {return d.x;})
        .attr("cy", function (d) {return d.y});

}
Adjacency Matrices
Go to the BlockAn adjacency matrix is a popular older method of representing networks. The nodes are repeated in lists along the x and y axes and if the nodes are connected, the intersecting grid square is filled.
Here is a simple adjacency matrix layout to play with in D3.
Code
function createAdjacencyMatrix(data) {

  var adjacencyMatrix = d3.layout.adjacencyMatrix()
  .size([800,800])
  .nodes(data.nodes)
  .links(data.links)
  .directed(false)
  .nodeID(function (d) {return d.name});

  var matrixData = adjacencyMatrix();

  console.log(matrixData)

  var someColors = d3.scale.category20b();

  d3.select("svg")
  .append("g")
  .attr("transform", "translate(50,50)")
  .attr("id", "adjacencyG")
  .selectAll("rect")
  .data(matrixData)
  .enter()
  .append("rect")
  .attr("width", function (d) {return d.width})
  .attr("height", function (d) {return d.height})
  .attr("x", function (d) {return d.x})
  .attr("y", function (d) {return d.y})
  .style("stroke", "black")
  .style("stroke-width", "1px")
  .style("stroke-opacity", .1)
  .style("fill", function (d) {return someColors(d.source.group)})
  .style("fill-opacity", function (d) {return d.weight * .8});

  d3.select("#adjacencyG")
  .call(adjacencyMatrix.xAxis);

  d3.select("#adjacencyG")
  .call(adjacencyMatrix.yAxis);
}
The Data
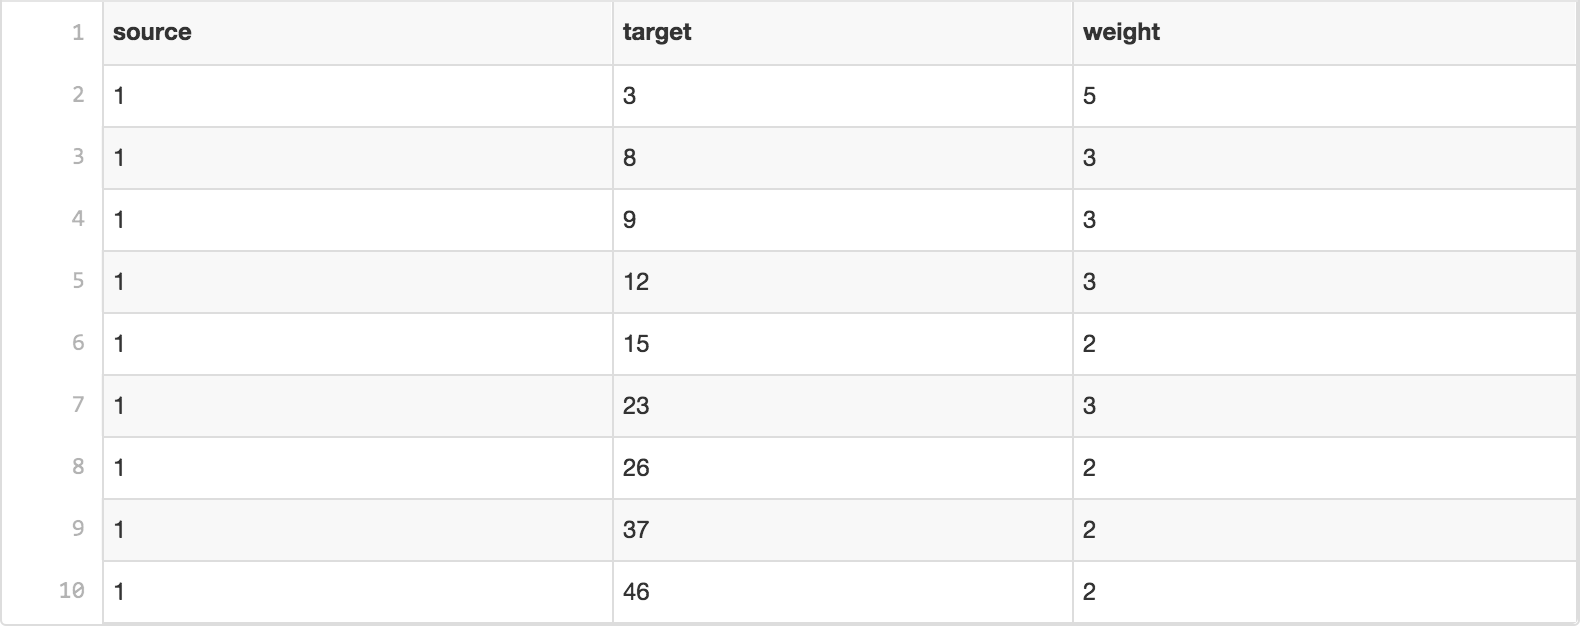
The dataset being used for this workshop is a table of links between consultants in a firm from Tore Opsahl's excellent set of example networks.
The list consists of connections from one consultant to another with a rating of the second consultant by the first (on a scale of 1 to 5).
Traditional Small Multiples
Go to the BlockThis small multiples view shows the ratings of each consultant by their peers. There's no legend or axes because this is a workshop, but the barcharts are arranged from 1 to 5 for each consultant, so you can see interesting distributions in the ratings.
Unlike most network data visualizations, this simple chart is actually readable and actionable.
Code
source,target,weight
1,37,2
1,46,2
2,1,1
2,4,2

var nestedData = d3.nest()
	.key(function (d) {return d.target})
	.key(function (d) {return d.weight})
	.entries(incData);
Just show me the network
Go to the BlockIf we just drop the entire edge list into D3, we get a network like this. No amount of color or layout settings will improve it.
Code
var nodeHash = {};
var nodes = [];
var edges = [];

incData.forEach(function (edge) {
	if (!nodeHash[edge.source]) {
		nodeHash[edge.source] = {id: edge.source, label: edge.source};
		nodes.push(nodeHash[edge.source]);
	}
	if (!nodeHash[edge.target]) {
		nodeHash[edge.target] = {id: edge.target, label: edge.target};
		nodes.push(nodeHash[edge.target]);
	}
	edges.push({source: nodeHash[edge.source], target: nodeHash[edge.target], weight: edge.weight});
});

var force = d3.layout.force().nodes(nodes).links(edges)
	.size([500,500])
	.charge(-200)
	.linkDistance(100)
	.on("tick", updateNetwork);
How Networks Lie
 More about the gestalt of network data visualization
Filtering
Go to the BlockBy filtering the network to only the connections showing a 5 (the highest) rating, we see interesting structure.
Code
if (edge.weight >= 5) {
  edges.push({source: nodeHash[edge.source], target: nodeHash[edge.target], weight: edge.weight});
}
Arrowheads
Go to the BlockOne way to representing the directionality in the network is via SVG marker arrowheads.
Code
var marker = d3.select("svg").append('defs')
    .append('marker')
    .attr("id", "Triangle")
    .attr("refX", 6)
    .attr("refY", 3)
    .attr("markerUnits", 'userSpaceOnUse')
    .attr("markerWidth", 6)
    .attr("markerHeight", 9)
    .attr("orient", 'auto')
    .append('path')
    .style("fill", "#CC9999")
    .attr("d", 'M 0 0 6 3 0 6 1.5 3');

d3.select("svg").selectAll("line")
	.data(edges)
	.enter()
	.append("line")
	.style("stroke-width", "1px")
	.style("stroke", "#CC9999")
	.attr("marker-end", "url(#Triangle)");


function updateNetwork() {
	d3.select("svg").selectAll("line")
	  .each(function (d) {
        deltaX = d.target.x - d.source.x;
        deltaY = d.target.y - d.source.y;

        pythag = Math.sqrt((deltaX * deltaX) + (deltaY * deltaY));

        adjustedX =  d.target.x - ((deltaX * 5) / pythag);
        adjustedY = d.target.y - ((deltaY * 5) / pythag);

        d3.select(this)
        .attr("x1", d.source.x)
        .attr("y1", d.source.y)
        .attr("x2", adjustedX)
        .attr("y2", adjustedY);
	  })

	d3.select("svg").selectAll("circle")
	  .attr("cx", function (d) {return d.x})
	  .attr("cy", function (d) {return d.y});
}
Curved Links
Go to the BlockAnother way to show directionality of links is via curving the links.
Code
function linkArc(d) {
  var dx = d.target.x - d.source.x,
      dy = d.target.y - d.source.y,
      dr = Math.sqrt(dx * dx + dy * dy);
  return "M" + d.source.x + "," + d.source.y + "A" + dr + "," + dr + " 0 0,1 " + d.target.x + "," + d.target.y;
}

function updateNetwork() {
	d3.select("svg").selectAll("path")
	.attr("d", linkArc);
Triangular Links
Go to the BlockA less common method for displaying directionality is to draw the edge as a shape, like a triangle, that indicates a source and a target.
Notice that it isn't necessarily clear which end is the source and which is the target. That's why you need legends.
Code
function arrowEdge(d) {
  var diffX = d.target.y - d.source.y;
  var diffY = d.target.x - d.source.x;

  var angle0 = ( Math.atan2( diffY, diffX ) + ( Math.PI / 2 ) );
  var angle1 = angle0 - ( Math.PI / 2 );
  var angle2 = angle0 + ( Math.PI / 2 );

  var x1 = d.source.x + (nodeSize * Math.cos(angle1));
  var y1 = d.source.y - (nodeSize * Math.sin(angle1));
  var x2 = d.source.x + (nodeSize * Math.cos(angle2));
  var y2 = d.source.y - (nodeSize * Math.sin(angle2));

  return "M" + x1 + "," + y1 + "L" + x2 + "," + y2 + " L " + d.target.x + "," + d.target.y + "z";
}

function updateNetwork() {
    d3.select("svg").selectAll("path")
    .attr("d", arrowEdge);
Offset Edges
Go to the BlockYou can also show edges side by side to indicate directionality or multiplex networks (networks where nodes are connected by multiple kinds of links).
Code
function offsetEdge(d) {
  var diffX = d.target.y - d.source.y;
  var diffY = d.target.x - d.source.x;

  var angle0 = ( Math.atan2( diffY, diffX ) + ( Math.PI / 2 ) );
  var angle1 = angle0 + ( Math.PI * 0.75 );
  var angle2 = angle0 + ( Math.PI * 0.25 );

  var x1 = d.source.x + (nodeSize * Math.cos(angle1));
  var y1 = d.source.y - (nodeSize * Math.sin(angle1));
  var x2 = d.target.x + (nodeSize * Math.cos(angle2));
  var y2 = d.target.y - (nodeSize * Math.sin(angle2));

  return {x1: x1, y1: y1, x2: x2, y2: y2}
}

function updateNetwork() {
	d3.select("svg").selectAll("line").each(function (d) {
	  var startCoords = offsetEdge(d);
	  d3.select(this)
	  .attr("x1", startCoords.x1)
	  .attr("y1", startCoords.y1)
	  .attr("x2", startCoords.x2)
	  .attr("y2", startCoords.y2)
	})
Parallel Edges
Go to the BlockParallel edges can be difficult to draw, especially when the edges are from nodes of different sizes. But they can be an effective method for representing multiplex networks or, in this case, a more striking method of indicating weight when weight is a count of connections between nodes.
Reciprocity
Go to the BlockSometimes, it doesn't matter what direction links are following in a network. Instead, what matters is that there is reciprocation (a link in both directions between two nodes).
Rather than getting stuck in traditional problems of how to draw arrowheads or curves, make sure you understand what a network is being used for, because it might allow you to address those needs with an entirely different method.
Code
if (edge.weight >= 5) {
  if (edgeHash[edge.target + "-" + edge.source]) {
    edgeHash[edge.target + "-" + edge.source].reciprocal = true;
  }
  else {
    var newEdge = {source: nodeHash[edge.source], target: nodeHash[edge.target], weight: edge.weight};
    edgeHash[edge.source + "-" + edge.target] = newEdge;
    edges.push(newEdge);
  }
}

d3.select("svg").selectAll("line")
  .data(edges)
  .enter()
  .append("line")
  .style("stroke-width", "2px")
  .style("stroke", function (d) {return d.reciprocal ? "#66CCCC" : "#996666"});
Labeling Nodes
Go to the BlockRepresenting nodes as a composite graphical shape, with a text label, is common. Labels add a tremendous amount of clutter and can quickly make a data visualization product unreadable, so be careful and use interactivity to reveal and hide labels.
Code
var nodeEnter = d3.select("svg").selectAll("g.node")
  .data(nodes)
  .enter()
  .append("g")
  .attr("class", "node")
  .call(force.drag());

nodeEnter.append("circle")
  .attr("r", 5)
  .style("fill", "#CC9999");

nodeEnter.append("text")
  .style("text-anchor", "middle")
  .attr("y", 15)
  .text(function (d) {return d.id})

function updateNetwork() {
    d3.select("svg").selectAll("g.node")
      .attr("transform", function (d) {return "translate(" + d.x + "," + d.y + ")"});
Using labels as nodes
Go to the BlockIt's tempting and sometimes appropriate to just use the label alone as a node. But keep in mind that significantly long labels will confuse network readers, as will dramatic differences in the lengths between labels.
Code
nodeEnter.append("text")
  .style("text-anchor", "middle")
  .attr("y", 5)
  .style("stroke-width", "4px")
  .style("stroke-opacity", 0.95)
  .style("stroke", "white")
  .text(function (d) {return d.id})

nodeEnter.append("text")
  .style("text-anchor", "middle")
  .attr("y", 5)
  .text(function (d) {return d.id})
Fixing networks and nodes
Go to the BlockOne of the most common interactivity techniques with networks is to freeze the network layout when the user mouses over a node. It's also common to give the user some mechanism to fix a node on the canvas, as is done here, and to release it.
Code
var nodeEnter = d3.select("svg").selectAll("g.node")
  .data(nodes)
  .enter()
  .append("g")
  .attr("class", "node")
  .on("click", nodeClick)
  .on("dblclick", nodeDoubleClick)
  .on("mouseover", nodeOver)
  .on("mouseout", nodeOut)
  .call(force.drag());

function nodeClick(d) {
    d.fixed = true;
}

function nodeDoubleClick(d) {
    d.fixed = false;
    force.start();
}

function nodeOver() {
    force.stop();
}

function nodeOut() {
    force.start();
}
Ego Networks
Go to the BlockSimple network analytical structures like ego networks are extremely useful for orienting readers. An ego network is simply all the nodes connected to a node, and can be extended out to 2nd and 3rd degree ego networks to show more rings of connections.
Code
function nodeOver(d) {
    force.stop();
    highlightEgoNetwork(d);
}

function nodeOut() {
    force.start();
    d3.selectAll("g.node > circle")
    .style("fill", "#CC9999");

    d3.selectAll("line")
    .style("stroke", "#996666")
    .style("stroke-width", "1px");
}

function highlightEgoNetwork(d) {
    var egoIDs = [];
    var filteredEdges = edges.filter(function (p) {return p.source == d || p.target == d});

    filteredEdges
	    .forEach(function (p) {
	      if (p.source == d) {
	        egoIDs.push(p.target.id)
	      }
	      else {
	        egoIDs.push(p.source.id)
	      }
	    });

    d3.selectAll("line")
    	.filter(function (p) {return filteredEdges.indexOf(p) > -1})
	    .style("stroke", "#66CCCC")
	    .style("stroke-width", "2px");

    d3.selectAll("circle")
    	.filter(function (p) {return egoIDs.indexOf(p.id) > -1})
    	.style("fill", "#66CCCC");
}

function updateNetwork() {
d3.select("svg").selectAll("g.node > circle")
  .attr("r", function (d) {return d.weight});
Deleting Nodes and Edges
Go to the BlockAllowing users to delete nodes and edges gives them the opportunity to better understand the data structure and physical simulation at play in a force-directed layout. They can interactively imagine scenarios such as what would happen, "if we lose this consultant" or "if this consultant no longer trusts this consultant".
That network perspective is what you need from your audience if a network data visualization is going to succeed, and interactively editing the topology helps provide it.
Code
edgeEnter
  .append("line")
  .attr("class", "highlight")
  .style("stroke-width", "8px")
  .style("stroke", "#66CCCC")
  .style("opacity", 0)
  .on("dblclick", deleteEdge)
  .on("mouseover", edgeOver)
  .on("mouseout", edgeOut);

var nodeEnter = d3.select("svg").selectAll("g.node")
  .data(nodes, function (d) {return d.id})
  .enter()
  .append("g")
  .attr("class", "node")
  .on("dblclick", deleteNode)
  .on("mouseover", nodeOver)
  .on("mouseout", nodeOut)
  .call(force.drag());

function deleteNode(d) {
    var currentNodes = d3.selectAll("g.node").data();
    var currentEdges = d3.selectAll("g.edge").data();
    var filteredNodes = currentNodes.filter(function (p) {return p !== d});
    var filteredEdges = currentEdges.filter(function (p) {return p.source !== d && p.target !== d});

    force.stop();
    force.nodes(filteredNodes);
    force.links(filteredEdges);

    d3.selectAll("g.node").data(filteredNodes, function (d) {return d.id})
    .exit()
    .transition()
    .duration(500)
    .style("opacity", 0)
    .remove();

    d3.selectAll("g.edge").data(filteredEdges, function (d) {return d.id})
    .exit()
    .transition()
    .duration(500)
    .style("opacity", 0)
    .remove();

    force.start();
}

function deleteEdge(d) {
    var currentEdges = d3.selectAll("g.edge").data();
    var filteredEdges = currentEdges.filter(function (p) {return p !== d});

    force.stop();
    force.links(filteredEdges);

    d3.selectAll("g.edge").data(filteredEdges, function (d) {return d.id})
    .exit()
    .transition()
    .duration(500)
    .style("opacity", 0)
    .remove();

    force.start();
}

function nodeOver() {
    d3.select(this).select("circle")
      .style("fill", "#66CCCC")
      .style("stroke", "#66CCCC")
      .style("stroke-width", "3px");
}

function nodeOut() {
    d3.selectAll("circle")
      .style("fill", "#CC9999")
      .style("stroke", "black")
      .style("stroke-width", "1px");
}

function edgeOver(d) {
    d3.select(this).style("opacity", 0.75);
}

function edgeOut() {
    d3.selectAll("line.highlight").style("opacity", 0);
}
Communities
Go to the BlockThere are dozens of community detections in network analysis. This uses one of the most common methods (Louvain modularity) to identify sub-structures in the network. These are very useful to break down a complex, abstract thing like a network into smaller more digestible chunks.
It's also helpful to name these communities after their most prominent member.
Code
var node_data = nodes.map(function (d) {return d.id});
var edge_data = edges.map(function (d) {return {source: d.source.id, target: d.target.id, weight: 1}; });

var community = jLouvain().nodes(node_data).edges(edge_data);
var result  = community();

nodes.forEach(function (node) {
  node.module = result[node.id]
});

modularityCensus(nodes, edges);

nodeEnter.append("circle")
  .style("fill", function (d) {return colors(d.module)});

function onlyUnique(value, index, self) {
  return self.indexOf(value) === index;
}

function modularityCensus(nodes, edges) {
  edges.forEach(function (edge) {
    if (edge.source.module !== edge.target.module) {
      edge.border = true;
    }
    else {
      edge.border = false;
    }
  });
  nodes.forEach(function (node) {
    var theseEdges = edges.filter(function(d) {return d.source === node || d.target === node});

    var theseSourceModules = theseEdges.map(function (d) {return d.source.module}).filter(onlyUnique);
    var theseTargetModules = theseEdges.map(function (d) {return d.target.module}).filter(onlyUnique);

    if (theseSourceModules.length > 1 || theseTargetModules.length > 1) {
      node.border = true;
    }
    else {
      node.border = false;
    }
  });
}
Network Mini-Maps
Go to the BlockBy nesting nodes into their hierarchical parents, such as detected communities, and mapping the connections across these groups, you can provide your users with even more context and accessibility to a complex network.
Code
var modules = nodes.map(function (d) {return d.module})
	.filter(onlyUnique)
	.map(function (d) {return {id: d, members: []}});

var moduleEdges = [];
var singletons = {id: "singletons", members: []};

var moduleNodeHash = {};

modules.forEach(function (module) {
	module.members = nodes.filter(function (d) {return d.module === module.id});
	moduleNodeHash[module.id] = module;

	if (module.members.length === 1) {
	  singletons.members.push(module.members[0]);
	}
});

modules.push(singletons);

var moduleEdgeHash = {};

edges.forEach(function (edge) {
	if (!moduleEdgeHash[moduleNodeHash[edge.source.module].id + "-" + moduleNodeHash[edge.target.module].id]) {
	  var moduleEdge = {source: moduleNodeHash[edge.source.module], target: moduleNodeHash[edge.target.module], weight: 1};
	  moduleEdgeHash[moduleNodeHash[edge.source.module].id + "-" + moduleNodeHash[edge.target.module].id] = moduleEdge;
	  moduleEdges.push(moduleEdge);
	}
	else {
	  moduleEdgeHash[moduleNodeHash[edge.source.module].id + "-" + moduleNodeHash[edge.target.module].id].weight += 1;
	}
})

return {nodes: modules, edges: moduleEdges}

var modularityGraph = modularityCensus(nodes, edges, result);

var modularityForce = d3.layout.force()
  .nodes(modularityGraph.nodes)
  .links(modularityGraph.edges)
  .size([125,125])
  .charge(function (d) {return d.members.length * -25})
  .gravity(0.75)
  .on("tick", updateModularityNetwork);

var mSVG = d3.select("#viz").append("svg")
  .attr("class", "modularity")
  .attr("height", 100)
  .attr("width", 100)
  .style("height", 100)
  .style("width", 100)
  .style("position", "absolute")
  .style("left", 375)
  .style("top", 375)
  .style("background", "white");

mSVG.selectAll("line")
  .data(modularityGraph.edges)
  .enter()
  .append("line")
  .attr("class", "modularity")
  .style("stroke-width", function (d) {return d.weight * 2})
  .style("stroke", "black");

mSVG.selectAll("circle")
  .data(modularityGraph.nodes.filter(function(d) {return d.members.length > 1}))
  .enter()
  .append("circle")
  .attr("class", "modularity")
  .attr("r", function (d) {return d.members.length})
  .style("stroke", "black")
  .style("stroke-width", "1px")
  .style("fill", function (d) {return d.id == "singletons" ? "lightgray" : colors(d.id)})

modularityForce.start();

function updateModularityNetwork() {
	d3.select("svg.modularity").selectAll("line")
	.attr("x1", function (d) {return d.source.x})
	.attr("y1", function (d) {return d.source.y})
	.attr("x2", function (d) {return d.target.x})
	.attr("y2", function (d) {return d.target.y});

	d3.select("svg.modularity").selectAll("circle")
	  .attr("transform", function (d) {return "translate(" + d.x + "," + d.y + ")"});
}
Linked Mini-Maps
Go to the BlockRather than calculating the position of the mini-map using its own force algorithm, tie the position to the constituent nodes to lessen confusion among your audience.
Code
function moduleOver(d) {
    d3.select(this)
    .style("stroke-width", "4px")
    d3.select("svg.main").selectAll("circle")
    .style("stroke-width", function (p) {return p.module == d.id ? "4px" : "1px"})
}

function moduleOut(d) {
    d3.select(this)
    .style("stroke-width", "1px")
    d3.select("svg.main").selectAll("circle")
    .style("stroke-width", "1px")
}

function updateNetwork() {
	d3.select("svg.modularity").selectAll("circle")
	    .each(function (d) {
	      var theseNodes = d.members;
	      var avgX = d3.mean(theseNodes, function (p) {return p.x});
	      var avgY = d3.mean(theseNodes, function (p) {return p.y});
	      d.x = avgX / 5;
	      d.y = avgY / 5;
	    })
	      .attr("transform", function (d) {return "translate(" + d.x + "," + d.y + ")"});

	d3.select("svg.modularity").selectAll("line")
	    .attr("x1", function (d) {return d.source.x})
	    .attr("y1", function (d) {return d.source.y})
	    .attr("x2", function (d) {return d.target.x})
	    .attr("y2", function (d) {return d.target.y});
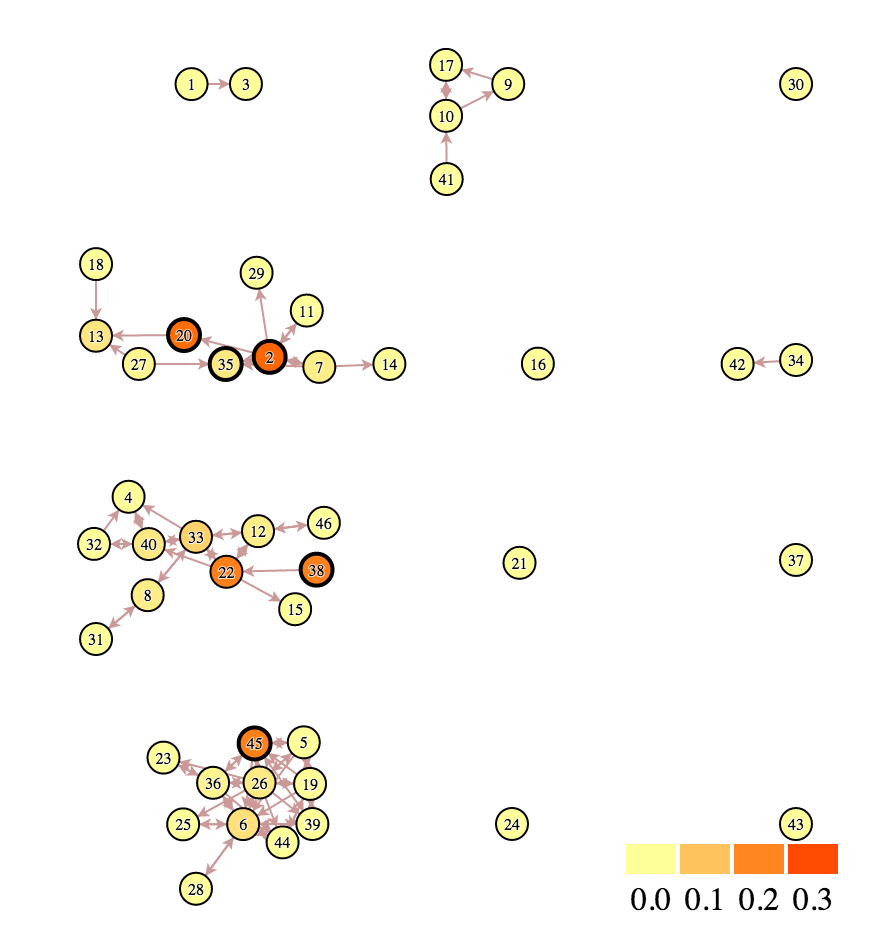
Grid display of components
Go to the BlockSplitting up the discovered communities and placing them visually in distinct locations is also useful for improving reader comprehension of the network.
Code
edges = edges.filter(function (d) {return d.border == false});

function updateNetwork(e) {
    var k = 10 * e.alpha;
    nodes.forEach(function(o, i) {
      var xPosition = (parseInt(o.module / 4) * 135) + 125;
      var yPosition = (o.module%4 * 110) + 75;
      var xDiff = Math.abs(o.x - xPosition);
      var yDiff = Math.abs(o.y - yPosition);
      var xDir = o.x - xPosition > 0;
      var yDir = o.y - yPosition > 0;
      if (xDiff > 25) {
        o.x += xDir ? -k : k;
      }
      if (yDiff > 25) {
        o.y += yDir ? -k : k;
      }
      if (xDiff > 100 || yDiff > 100) {
        force.alpha(0.099);
      }
    });
Making connections
Go to the BlockJust like the earlier example of deleting nodes and edges, the ability to connect nodes allows users to suggest network perspective questions about the state of the network you're representing.
Code
var drag = force.drag()
  .on("drag", drag)
  .on("dragend", dragend)
  .on("dragstart", dragstart);

var nodeEnter = d3.select("svg.main").selectAll("g.node")
  .data(nodes, function (d) {return d.id})
  .enter()
  .append("g")
  .attr("class", "node")
  .call(drag);

function dragstart() {
    nodes.forEach(function (node) {
      node.fixed = true;
    })
}

function drag(d) {
    var nodeDom = this;
    var foundOverlap = false
    nodes.forEach(function (otherNode) {
      var distance = Math.sqrt(Math.pow(otherNode.x - d.x, 2) + Math.pow(otherNode.y - d.y, 2));
      if (otherNode != d && distance < 16) {
        foundOverlap = true;
      }
    })
    if (foundOverlap == true) {
      d3.select(nodeDom).select("circle.background")
        .style("opacity", 0.5)
    }
    else {
      d3.select(nodeDom).select("circle.background")
        .style("opacity", 0)
    }
}

function dragend(d) {
    force.stop();

    d3.selectAll("circle.background")
      .style("opacity", 0);

    nodes.forEach(function (otherNode) {
      otherNode.fixed = false;
      var distance = Math.sqrt(Math.pow(otherNode.x - d.x, 2) + Math.pow(otherNode.y - d.y, 2));
      if (otherNode != d && distance < 16) {
        var newEdge = {id: d.id + "-" + otherNode.id, source: d, target: otherNode};
        if (edges.map(function (d) {return d.id}).indexOf(newEdge.id) == -1) {
          edges.push(newEdge);
        }
      }
    });
    force.links(edges);

    var edgeEnter = d3.select("svg.main").selectAll("g.edge")
      .data(edges, function (d) {return d.id})
      .enter()
      .insert("g", "g.node")
      .attr("class", "edge");

    edgeEnter
      .append("line")
      .style("stroke-width", function (d) {return d.border ? "3px" : "1px"})
      .style("stroke", "black")
      .style("pointer-events", "none");

    var community = jLouvain().nodes(node_data).edges(edge_data);
    var result  = community();

    nodes.forEach(function (node) {
      node.module = result[node.id]
    });

    node_data = nodes.map(function (d) {return d.id});
    edge_data = edges.map(function (d) {return {source: d.source.id, target: d.target.id, weight: 1}; });

    modularityCensus(nodes, edges, result);

    d3.selectAll("circle.foreground")
    .style("fill", function (d) {return colors(d.module)})
    .style("stroke-width", function (d) {return d.border ? "3px" : "1px"});

    force.start();
}
Measuring Centrality
Go to the BlockIn-the-browser network statistics can further improve readability, but they require you to understand the centrality measures being calculated. Depending on the type of network, pathfinding can also be useful for providing context to readers.
Code
var node_data = nodes.map(function (d) {return d.id});
var edge_data = edges.map(function (d) {return [d.source.id, d.target.id]; });

//var G = new jsnx.cycleGraph();
var G = new jsnx.Graph();
G.addNodesFrom(node_data);
G.addEdgesFrom(edge_data);

var betweenness = jsnx.betweennessCentrality(G);
var eigenvector = jsnx.eigenvectorCentrality(G);
var clustering = jsnx.clustering(G);

var evExtent = d3.extent(d3.values(eigenvector._stringValues));
var bwExtent = d3.extent(d3.values(betweenness._stringValues));
var clExtent = d3.extent(d3.values(clustering._stringValues));

var colorScale = d3.scale.linear().domain([0,1]).range(["#ffff99", "#ff6600"]);
var sizeScale = d3.scale.linear().domain([0,1]).range([4,10]);

function byEV() {
  sizeScale.domain(clExtent);
  colorScale.domain(evExtent);
  d3.selectAll("circle")
    .transition()
    .duration(1000)
    .style("fill", function (d) {return colorScale(eigenvector._stringValues[d.id])})
    .attr("r", function (d) {return sizeScale(clustering._stringValues[d.id])})
    .transition()
    .delay(2000)
    .each("end", function() {
      byBW();
    })
}
Advanced Techniques
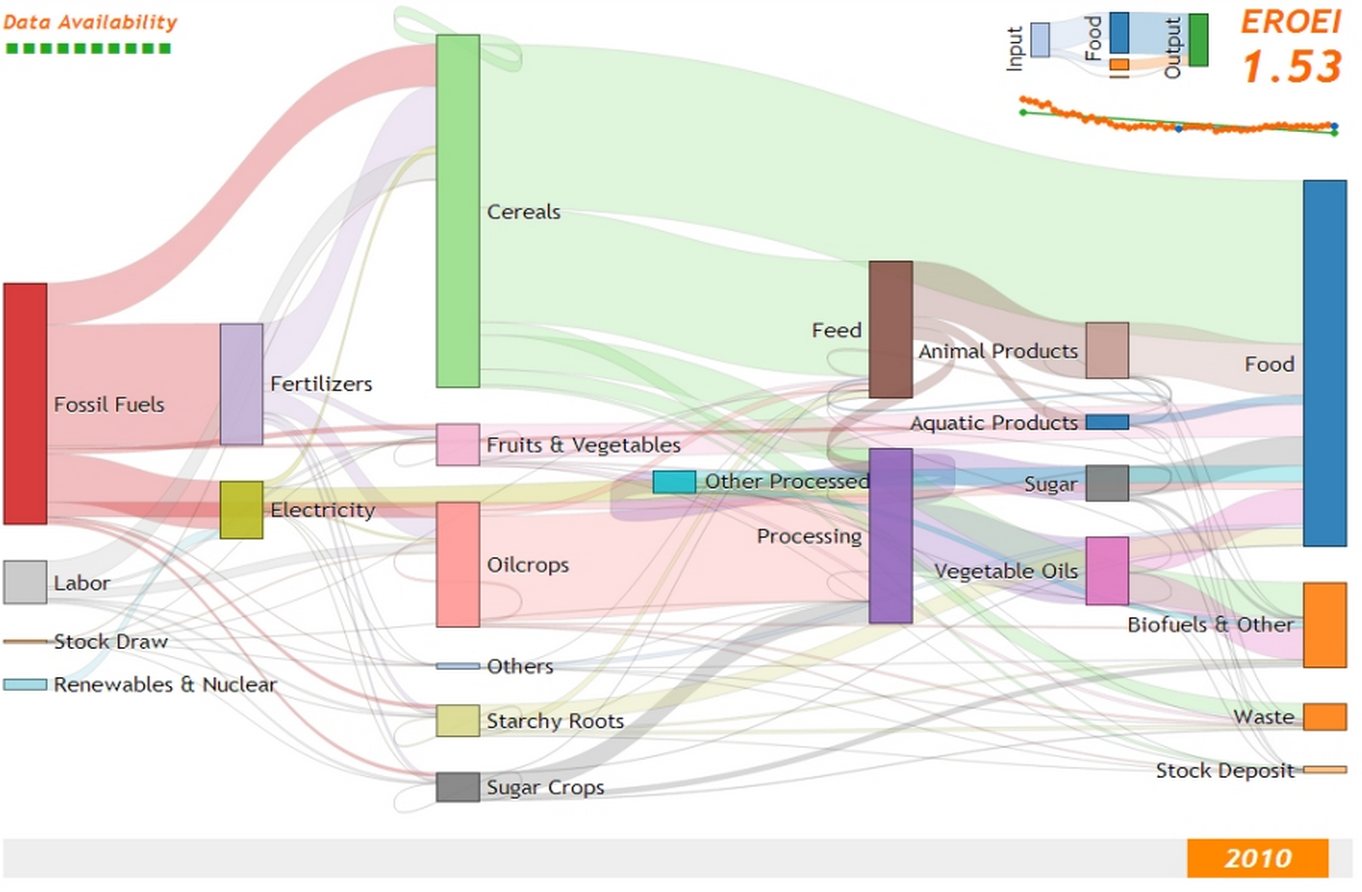
Sankey Layout
Go to the BlockNon-DAG Sankeys